
Last week, a client mentioned the comments made in the State of the Union. The President of The United States had remarked that “snack companies think you won’t notice when they charge you just as much for the same size bag but with fewer chips in it” and “you probably all saw that commercial on Snickers bars and you get charged the same amount, and you got about, I don’t know, 10 percent fewer Snickers” during the speech.
The team at Snickers immediate refuted, but our client still questioned how shoppers perceive the impact of this “shrinkflation” approach to mask price increases. She asked if shoppers really pay more attention to the size versus the price of a package. We smiled when we heard the question because of (1) how this important consideration is returning to considerable attention and (2) why Middlegame has a pathway to answer it.
Shrinkflation has been a tool for hiding price increases for quite a long time. The New York Times references the practice being used in the coffee category as far back as 1988. A different client that we have worked with for many years has always referred to it as CPA, meaning the “cheater pack approach” since shoppers are tricked into paying the same amount for less actual product. However, the market is not so easily tricked these days. A recent YouGov poll found that 82% of their survey respondents are concerned about shrinkflation, with most of them are very concerned. Snack foods and confectionary are the items cited in the survey as most noticed for the size decrease.
Shrinking the size of packages can be a highly creative exercise. My personal favorite is indenting the bottom of the jar, so no visible change is apparent at the shelf … very sneaky! There are differing opinions on whether shrinkflation represents passing through increases in the Cost of Goods Sold (COGS) or if it is simply padding Gross Profit (GP) and Operating Income (OI) that drives shrinkflation. Shoppers tend to feel that it is greedy profiteering. However, our experience suggests that the profit-only motive is more often related to “skimpflation” where intentionally cheaper ingredients and materials produce an inferior product, but the brands claim to have maintained a consistent quality.
Now that we have put things into context, let us get back to answering the big question. Middlegame has been quantifying the impact of price change versus size change with clients for quite a while. Our Competitive Interaction Analysis (CIA)® platform for shopper response analytics provides the opportunity to simultaneously evaluate both price per unit and price per volume. Based on this, we have been able to compile a series of price and size elasticity results for the past couple of years:
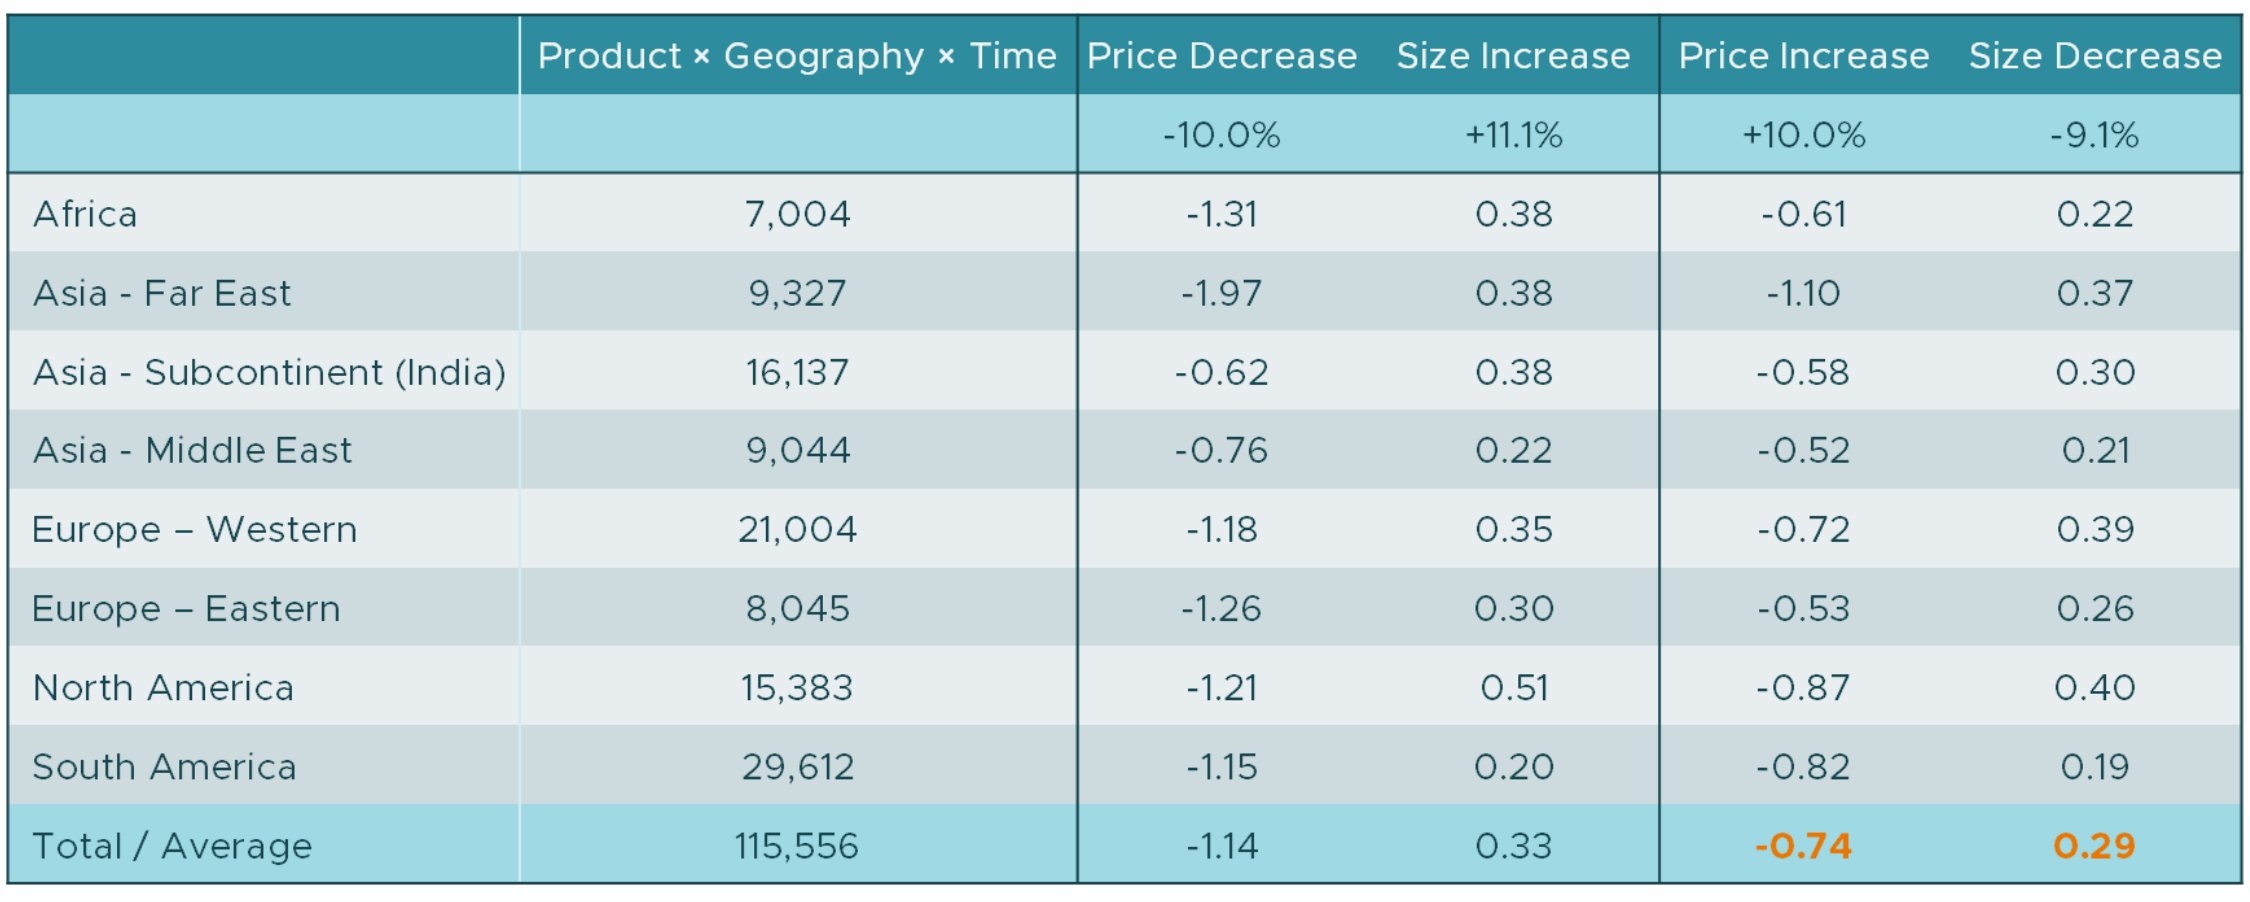
Source: 115,556 SKU Assessments between September 2022 and February 2024 performed by Middlegame
Price elasticity is a common measurement in Revenue Growth Management where we explain the impact of changing the price of an existing product and maintaining the size of the package. Size elasticity is a little more specific to how Middlegame sees shopper response and defines the impact of changing the size of a package but keeping a constant price.
For example, on average we found that most regions are “inelastic” to a price increase of +10.0%. The average elasticity is −0.74, so the demand decline is −7.4% = +10.0% × −0.74. An equivalent size decrease of -9.1% also has an inelastic effect such that demand would decline by −2.7% = −9.1% × 0.29.
Based on these thousands of results comparing price and size elasticity that we have performed in the last couple of years, price elasticity is overwhelmingly more impactful than size elasticity. Shoppers are much quicker to reject the price increase than the size decrease. However, the assessment should not end there. Despite the elasticities, it is not a “no-brainer” to simply decrease the size of the package when confronted with an increase in the Cost of Goods Sold (COGS). You must look beyond the impact on volume. What is the impact on value, i.e., euros, dollars, rupees, etc.?
A price increase has a significant larger demand drop than a size decrease. However, the price increase also has the offsetting price increase to counterbalance the demand drop. A size decrease only has a demand decline. Therefore, the value change using the numbers above is (1 + −7.4%) × 1.10 = +1.02 for the price increase while the size decrease is (1 + −2.7%) × 1.00 = +0.97. The price increase actually generates +2.0% in value while the size decrease remains at a loss! A more detailed demonstration of the tradeoff is found in our Salty Snacks case study.
Inflation is starting to be tamed in many of the markets where it created quite an uproar over the couple of years, but for other markets it remains a monthly or even daily organizational issue. For standard econometric modeling techniques that rely on time-aligned variation, this can be incredibly problematic. On the other hand, a more comprehensive approach like our “Wide-Angle View” can make navigating these crazy economic conditions far more manageable and help you make your next move with confidence.
Middlegame is the only ROMI consultancy of its kind that offers a holistic view of the implications of re-source allocation and investment in the marketplace. Our approach to scenario-planning differs from other marketing analytics providers by addressing the anticipated outcome for every SKU (your portfolio and your competitors) in every channel. Similar to the pieces in chess, each stakeholder can now evaluate the trade-offs of potential choices and collectively apply them to create win-win results.
Contact us at middlegame.com