Solving a Pricing Dilemma for Popular Salty Snacks
LOCATION: USA
A salty snack manufacturer faced a pricing problem: Should they pass through a cost of goods increase through price per volume or price per unit?

Situation Review
Opportunity Assessment
Scenario Definition
Expectation Analysis
Client Actions
SITUATION REVIEW
Looking for a Solution to Sink Their Teeth Into
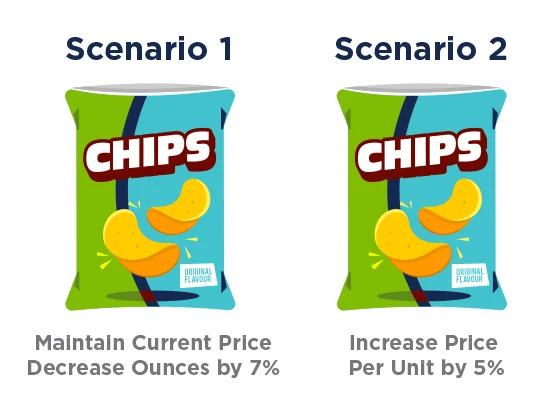
A major salty snacks manufacturer was faced with a significant increase in raw material prices due to fluctuation in the commodities markets. To offset these cost increases and break even, the client needed to generate additional revenue equivalent to a 5% increase in retail price for the entire product line. Further analysis by the finance team revealed that the average cost of goods sold was
approximately 70%. For marketing, this meant that they could do one of two things: maintain current prices and ask operations to decrease the ounces per package by 7% or simply increase the price per unit by 5%. Both had implications from a shopper as well as competitor standpoint.
OPPORTUNITY ASSESSMENT
Brushing Up on Product and Marketing Options
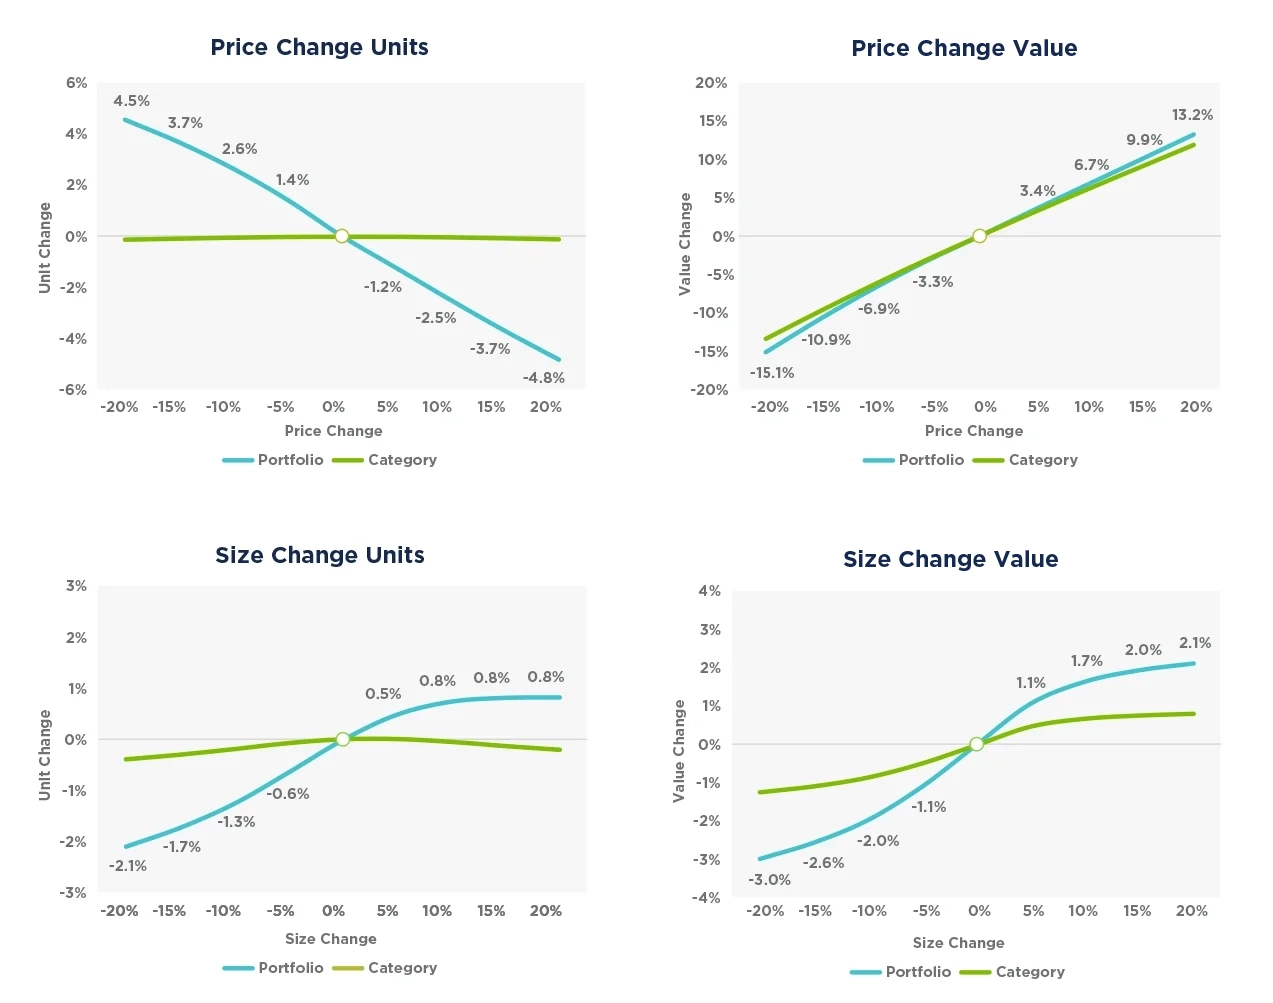
Since the portfolio was 68% of the category unit share across retailers, the majority of price impacts would be absorbed within the portfolio, essentially cancelling each other out. The CIA® platform estimated that the unit elasticity was associated with a 5% price increase of only -0.241. Given this inelastic demand, price increases converted into a positive retail dollar increase. Net portfolio size changes were positively correlated with unit sales. A bigger bag at the same price would induce more shopper transactions, but the response was far less pronounced than price. The unit elasticity associated with a 7% price decrease was estimated as -0.884, but the impact of a size decrease was stronger than a price increase. At the same time, the dollar sales fell with the unit decline since there was no offsetting price increase.
SCENARIO DEFINITION
Was a “Complete” Solution the “Total” Answer?
The commercial team leading the overall category management assessment wanted their contribution to the category to be better reflected in their access to merchandising events. But they needed to generate a “win-win” story for the retailers. Using the CIA® platform, Middlegame tested the reallocation of merchandising so that the SKUs of the premium and mainstream brands received a fair share of support based on their ability to deliver retailer euros. As part of addressing the “win-win”, CIA® displayed the simultaneous impact on the SKUs, the portfolio as a whole, and the total category for each retailer.

EXPECTATION ANALYSIS
Clear Examination for an Informed Decision
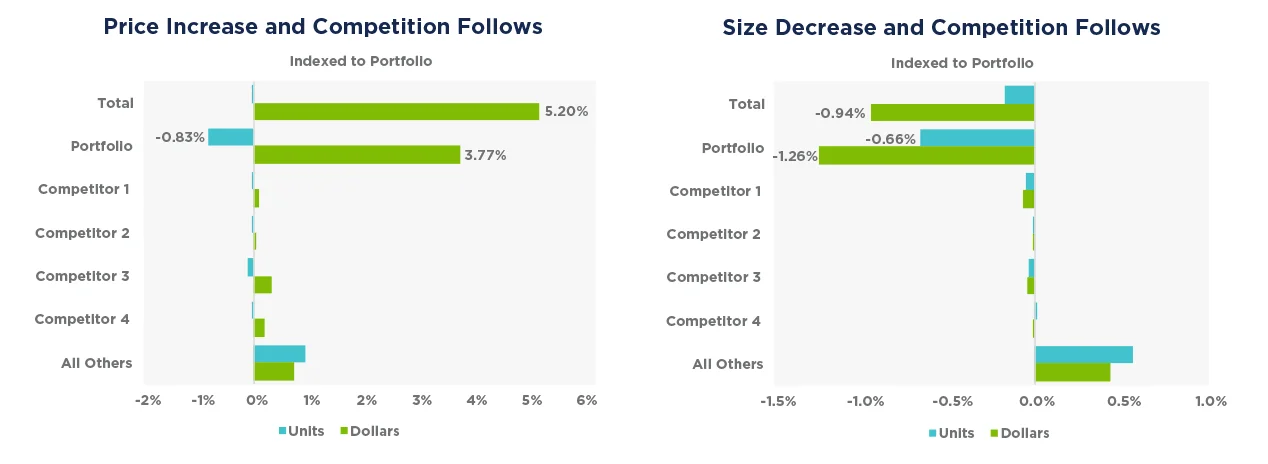
A total of four additional scenarios were tested to address the combinations of price change versus size change for the manufacturer’s portfolio and the competition. These were integrated with the two results assuming no competitive reaction in the Opportunity Assessment. The models for the CIA® platform suggested that softer unit sales declined and improved the dollar sales gain if the
competition matched the price increase. The models also estimated that if key competitors followed the size decrease, there would be minimal impact on the decline in unit sales relative to the portfolio taking this action alone. Digging deeper, the CIA® platform displayed the simultaneous impact on the SKUs, the portfolio as a whole, and the total category as well as compared the difference in results across retailers.

CLIENT ACTIONS
Results to Smile About
Despite the hesitation to raise prices, the client decided that it was a better overall strategy than to decrease the package size. This leveraged the overall inelastic demand due to such a commanding share of the category across retailers. As expected, the competition reacted with a series of matching price increases over the next two months. After a six-month review, the portfolio was down in units and volume versus the prior period, but more than 84% of retailers actually saw a slight increase in dollar sales of 3.4% to 4.2% which was consistent with the original elasticity analysis.