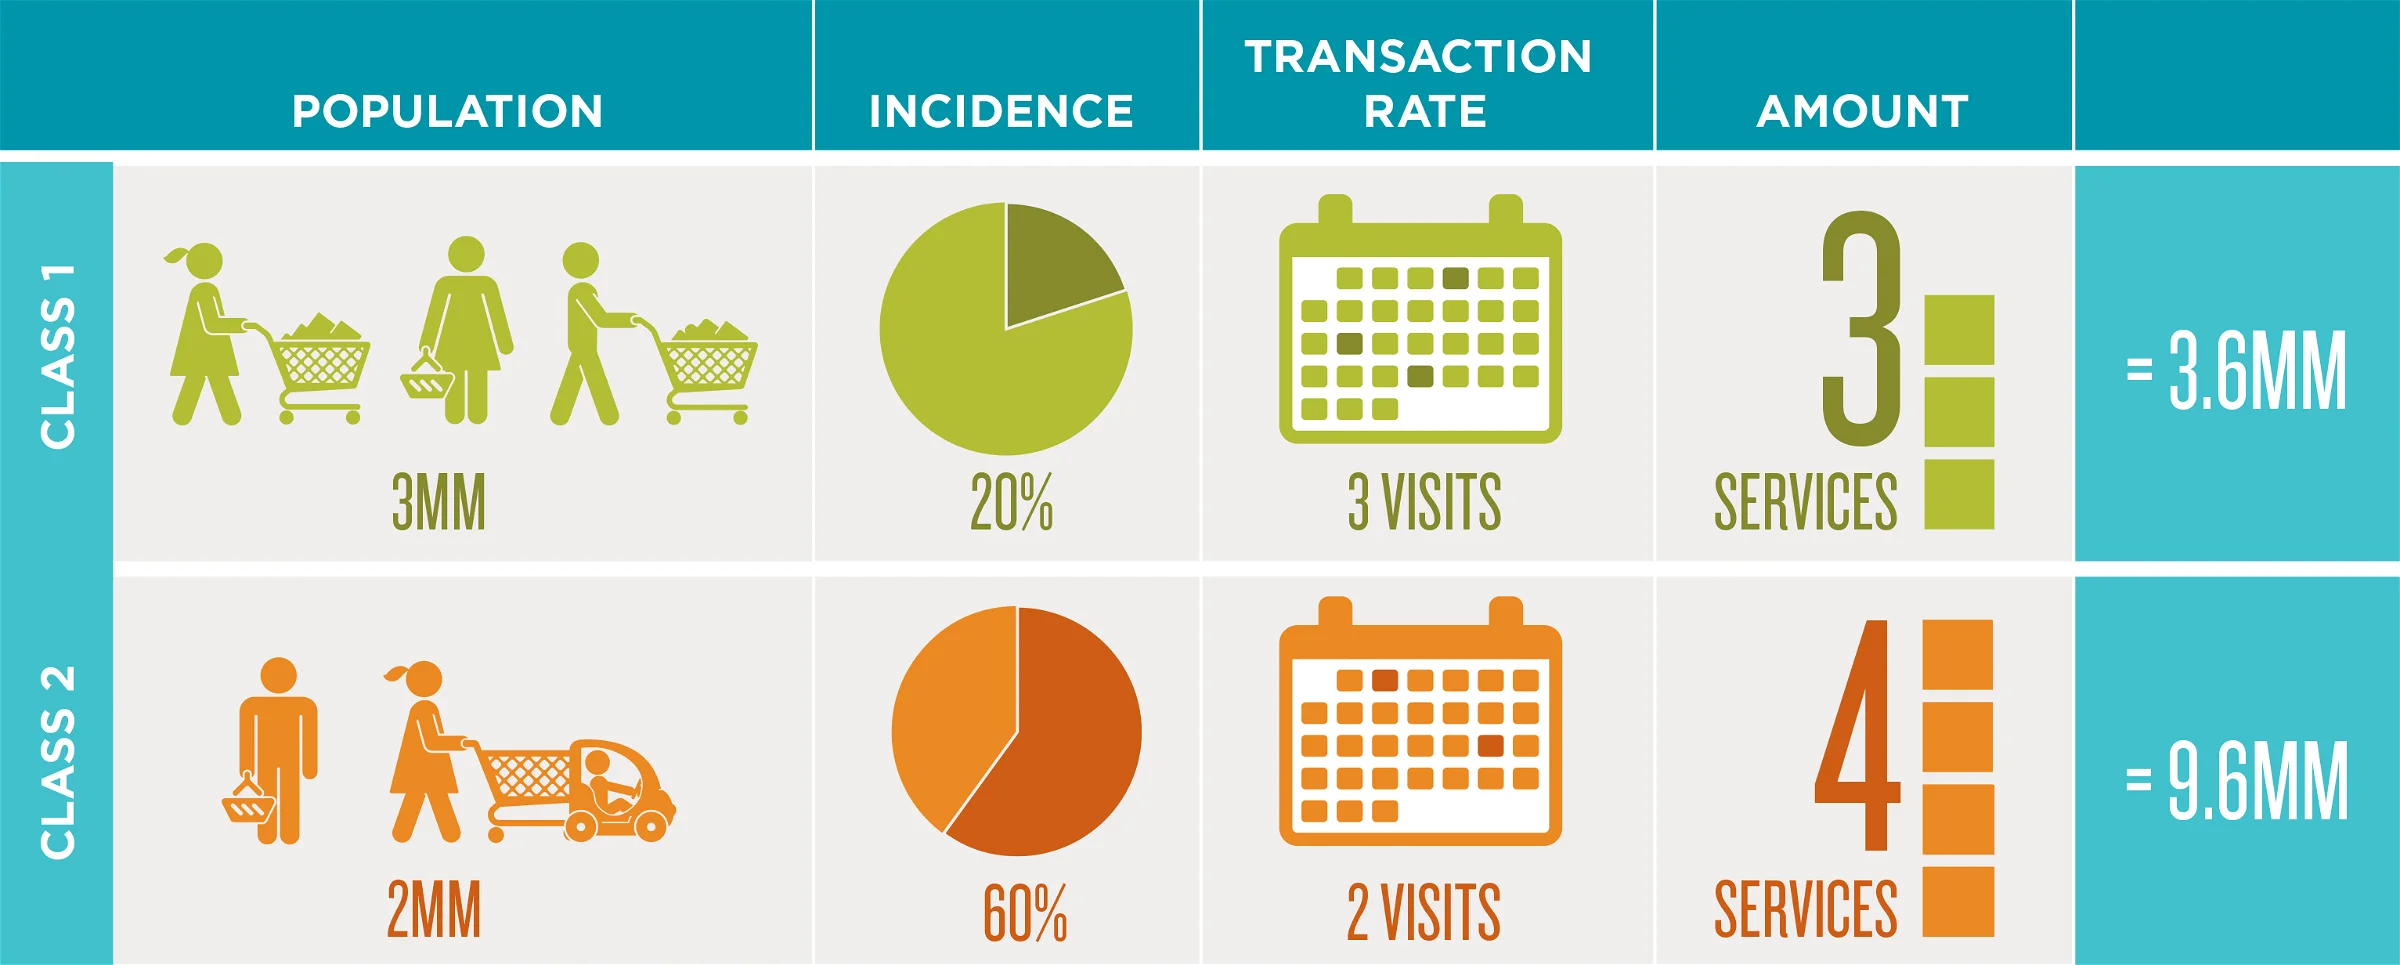
While at The Coca-Cola Company, I was introduced to a fairly straightforward approach to comparing markets and their potential. It was called the PITA Model. PITA is a method for breaking down sales into the components that are the real drivers of sales. I talk about this a lot and even brought it up in a recent conversation with Pedro Antonio Garcia Lopez that we included as another blog. I thought that I would do a quick overview for those who weren’t raised in the Coca-Cola System.
The PITA Model helps managers understand the potential for their products or services. The model takes four parameters into account:
Population: This is the total population by segment. All individuals in segments are part of the population regardless of whether they use your products and services or not.
Incidence: This is the penetration rate (share of individuals in the population that are users/customers of your products and services). Marketing activities (as well as the perceptions the population have about your brands) are crucial to both acquisition of new users and the retention of loyal users.
Transaction Rate (sometime called Times): This is the average number of times that users interact with your products and services. It is important to convert new users into loyal users, but transaction rate explains how heavy or light the users are. Marketing activities and the perceptions of the population can equally influence the transaction rate.
Amount: This is the number of products or services per transaction. Again, it is also dependent on marketing activities and the perceptions of the population.
The product that PITA measures (P × I × T × A) is the total number of products and services rendered for a given customer segment.

The sum of PITA products across segments is the total sales for a given market or country. It creates an incredibly useful way to understand why certain markets are performing differently than other markets. At Middlegame, we have extended the PITA formula with the additional component of V for sales value (dollars, euros, yuan, etc.). PITAV tags on the average price paid by shoppers.
Almost all of the metrics are readily available in the typical retail tracking data regardless of scanning or audit. In many emerging markets, we skip over incidence or penetration due to limited data at the level of time we require, but still offer similar insights into where the real problem resides.
Middlegame is the only ROMI consultancy of its kind that offers a holistic view of the implications of resource allocation and investment in the marketplace. Our approach to scenario-planning differs from other marketing analytics providers by addressing the anticipated outcome for every SKU (your portfolio and your competitors’) in every channel. Similar to the pieces in chess, each stakeholder can now evaluate the trade-offs of potential choices and collectively apply them to create win-win results.
